Coca Cola United
Lead UX Consultant
The Strategic Problem
Coca-Cola United’s field sales reps relied on a Power BI dashboard that was overloaded, slow, and confusing - leading to low adoption and missed opportunities in store-level profit conversations. Insights were buried beneath visual noise, and reps lacked the confidence and clarity to influence retailers toward more profitable product decisions.
The result? Lost margin, inconsistent sales narratives, and underutilized data during retail visits.
My Approach
I led the end-to-end redesign of the dashboard, focusing not just on interface polish but on business enablement at the store level. My goal was to elevate the rep experience by transforming raw data into tools that support real-time negotiation, category mix planning, and profit modeling.
To do this, I:
Participated in discovery sessions with BI stakeholders and sales leaders to uncover usage friction, rep workflows, and KPI blind spots
Audited the Power BI dashboard for cognitive overload, poor prioritization, and inconsistent filtering logic
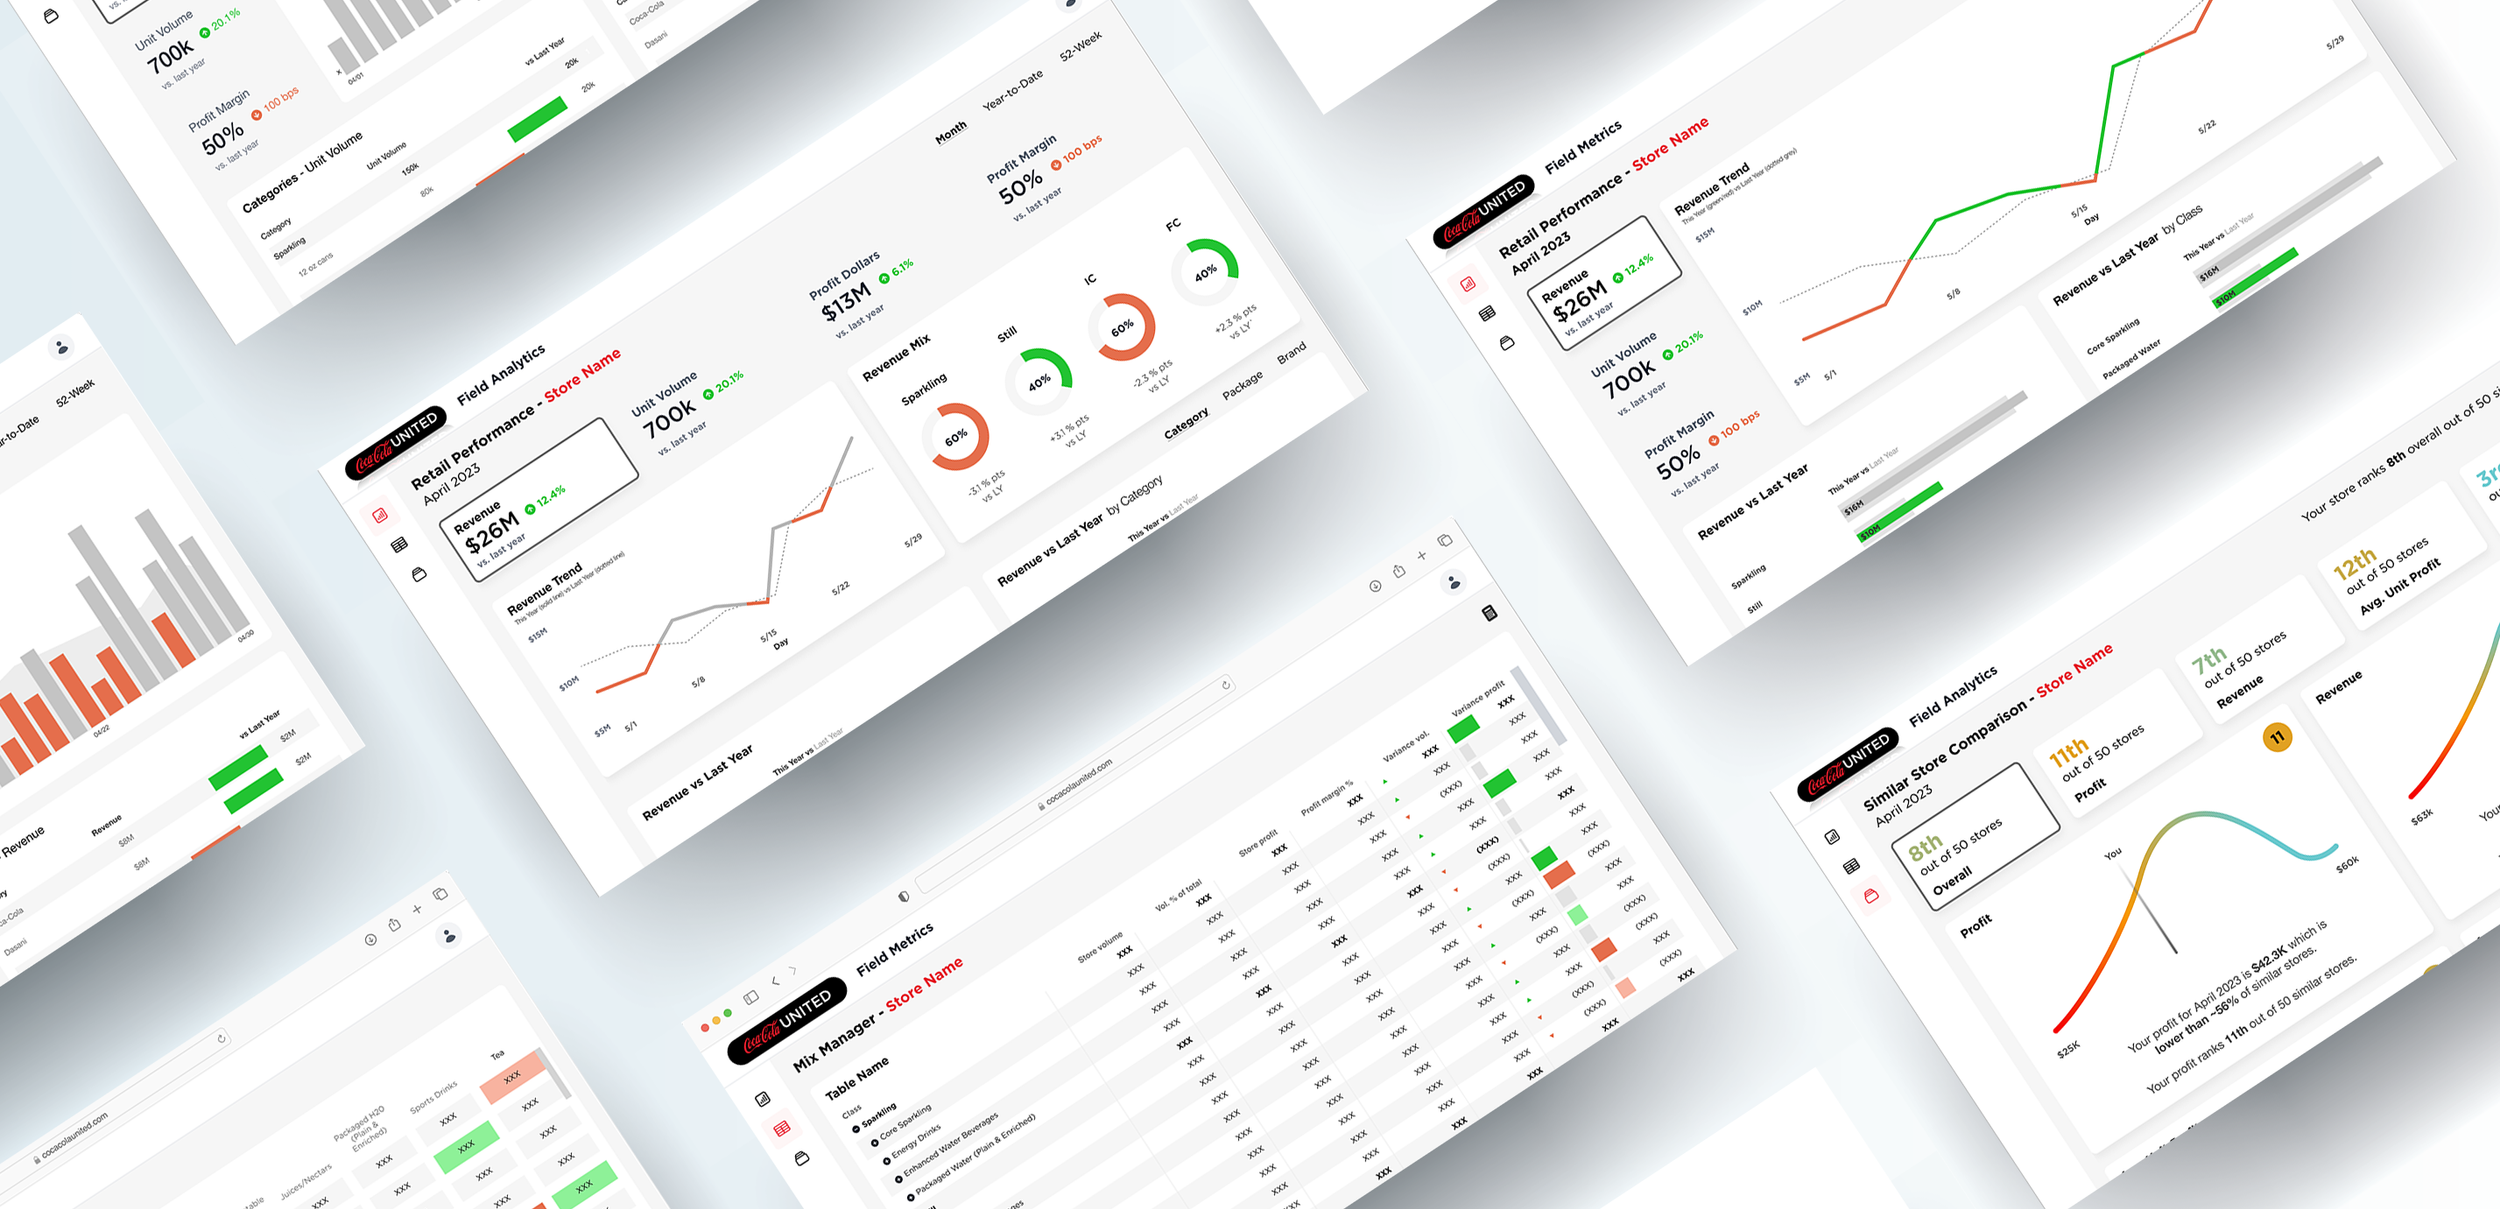
Prototyped a new design in Figma, prioritizing clarity, speed, and readiness for use in field visits
Partnered with engineers and BI analysts to implement usable, performant visualizations that could scale across regions


Key Tools Reimagined
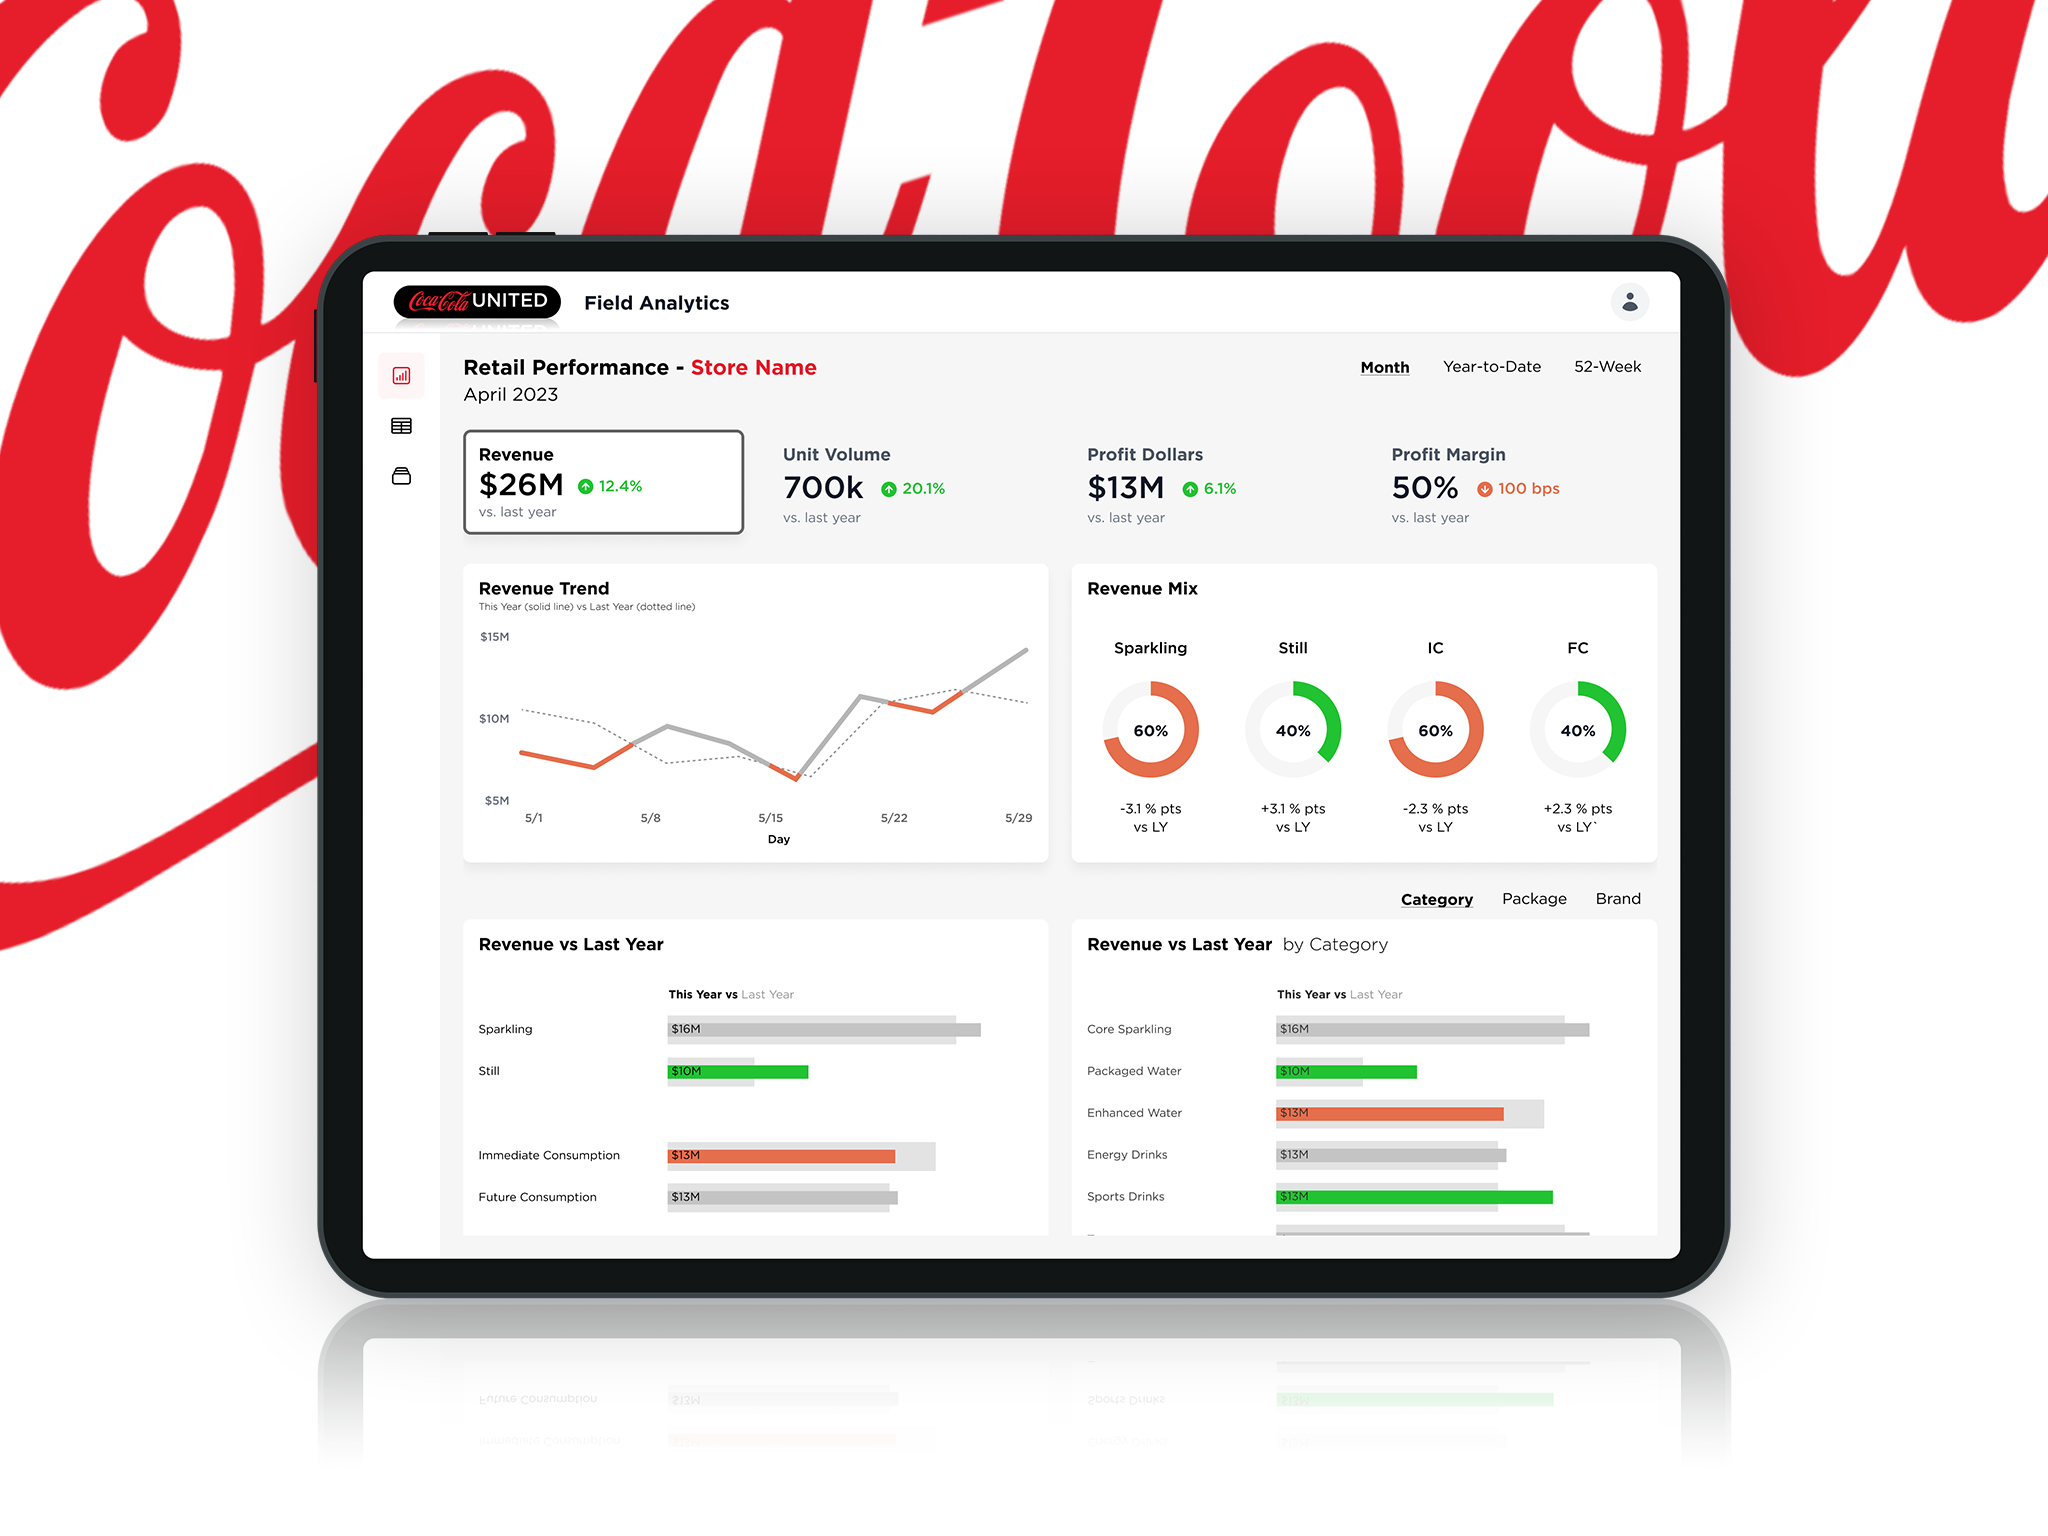
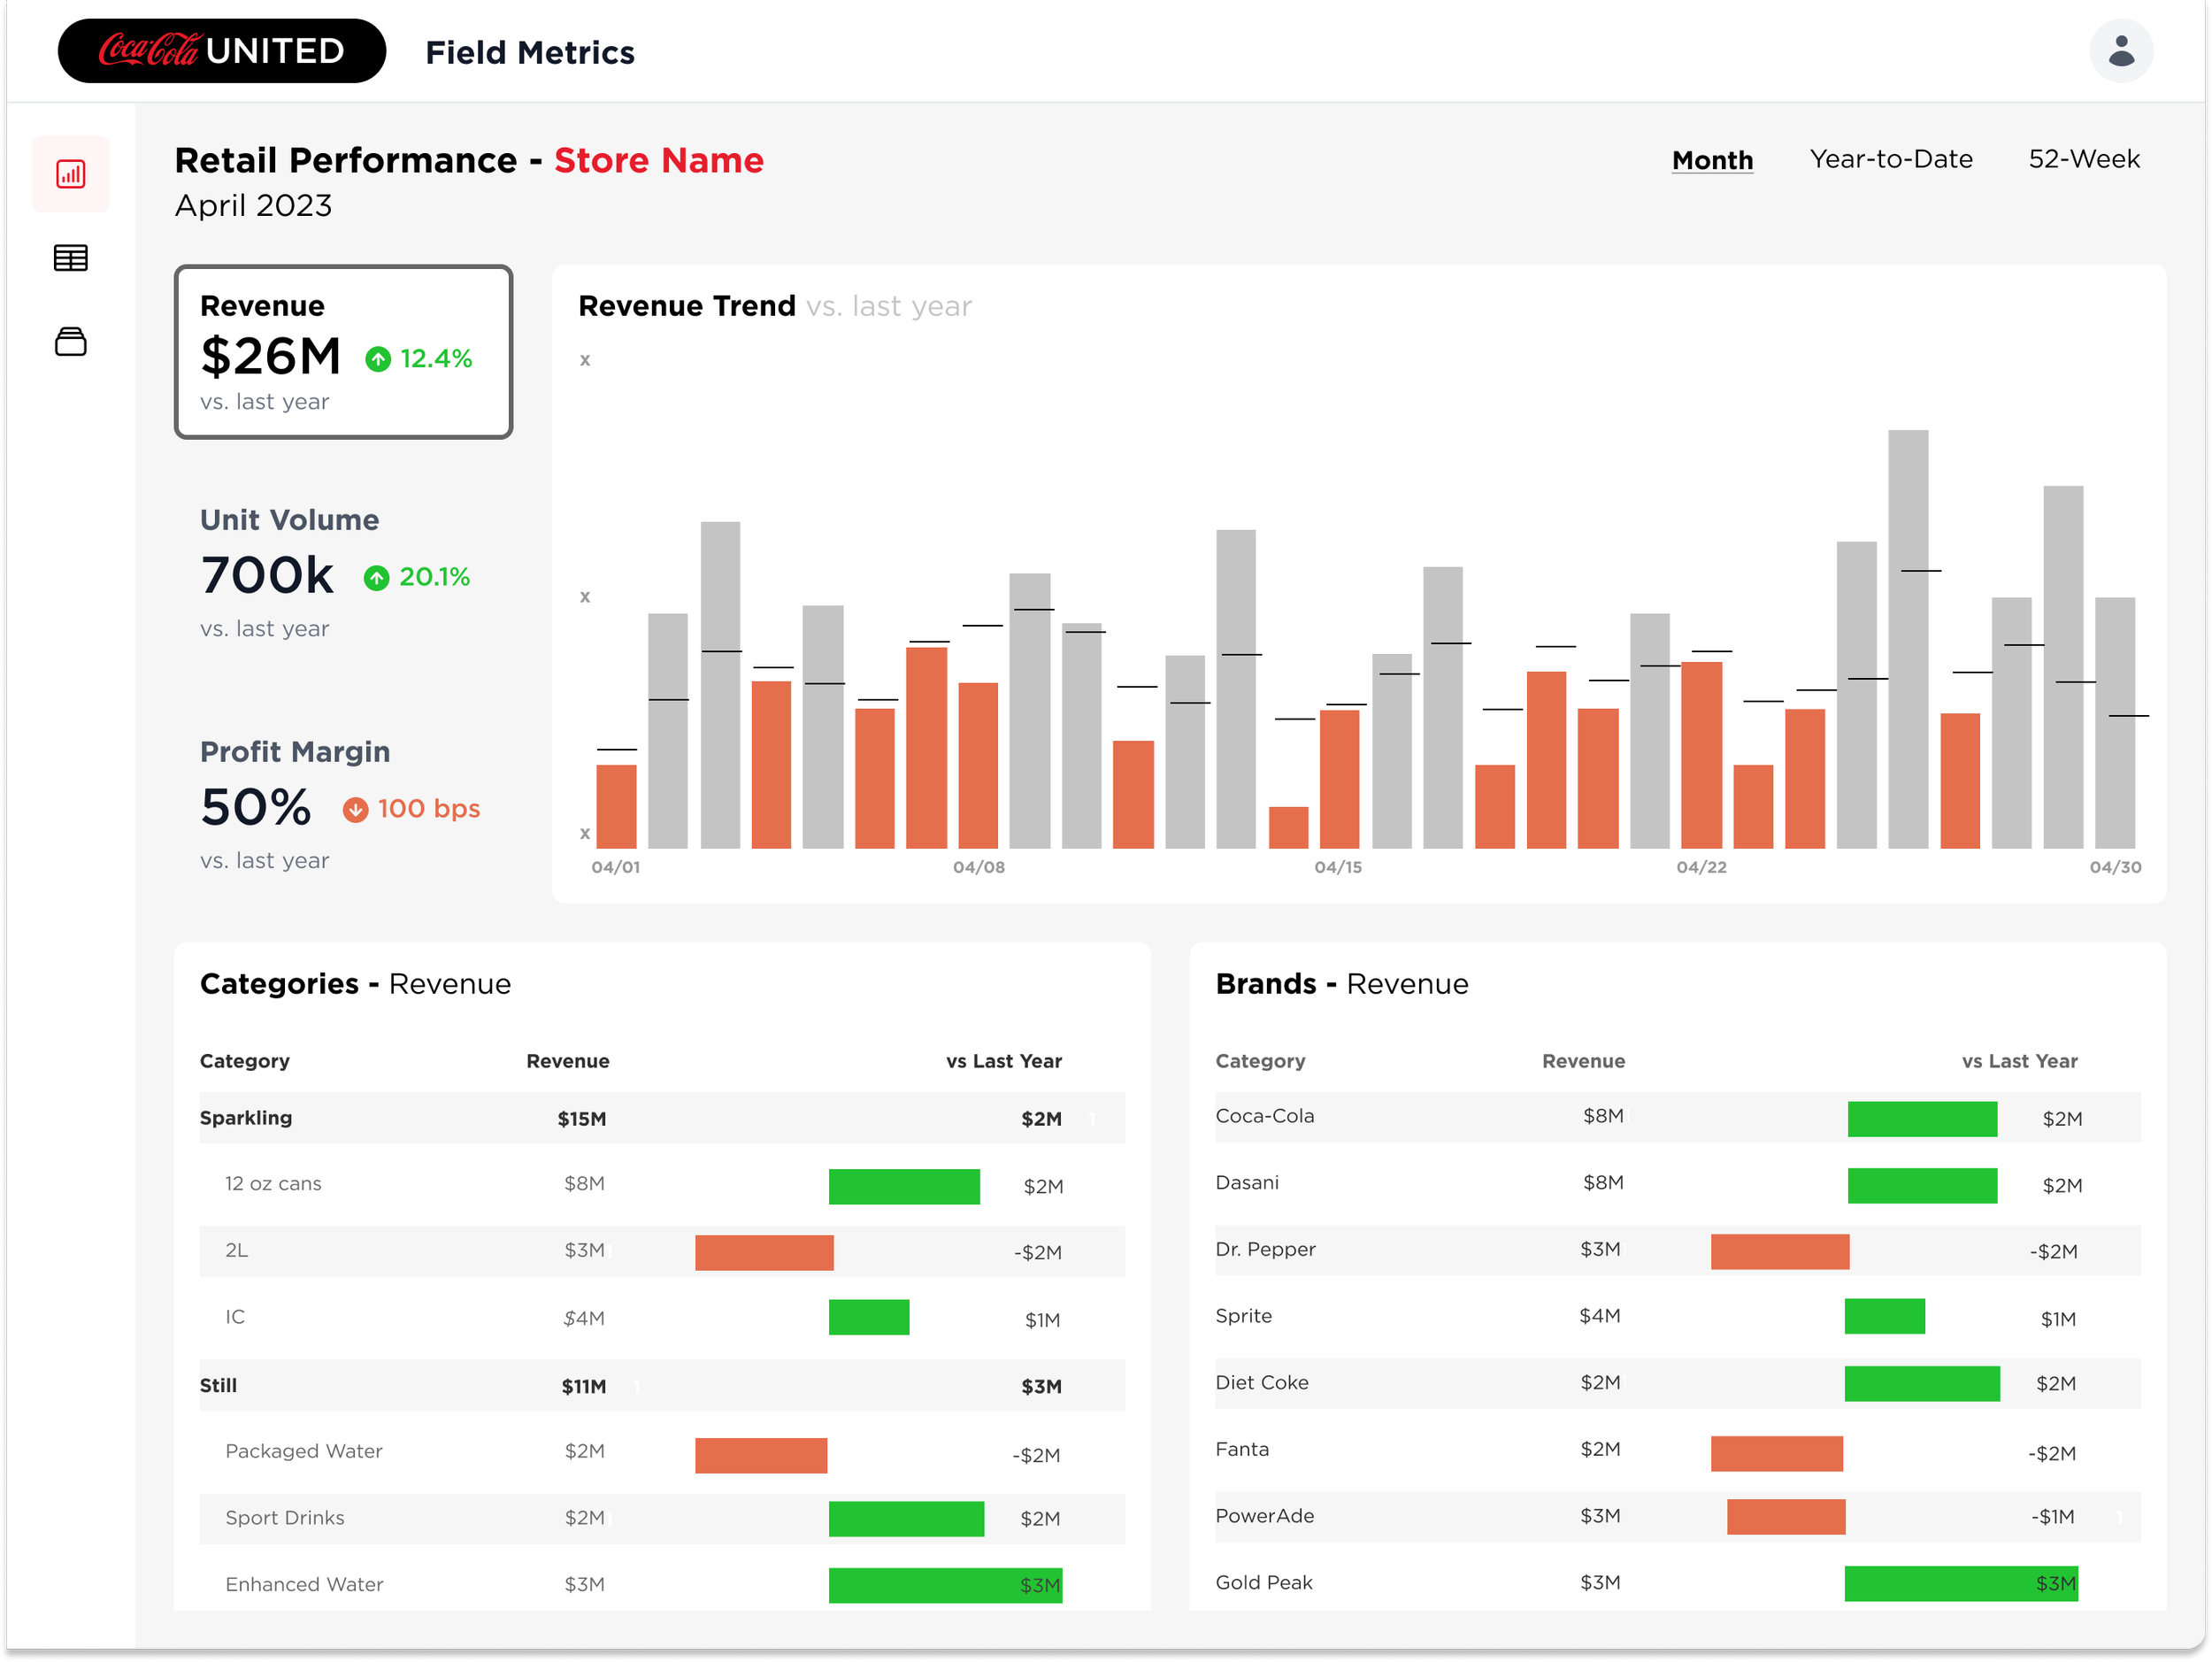
Retail Revenue & Margin Overview - quick-glance view of volume and profitability
Category Mix Manager - decision support for upselling high-margin products
Similar Outlet Benchmarking - surfaced comps to uncover underperformance
Order Mix Scenario Tool - modeled profit trade-offs in-store during visits
Results
Increase in adoption among field reps (per internal usage logs)
Faster prep time, stronger in-store confidence, and clearer sales conversations
Sales leaders described the new tool as a “game changer” for margin improvement strategy
Helped elevate UX visibility within Coca-Cola United’s organization, leading to additional roadmap investment
Strategic Takeaway
Designing for field reps isn’t about dashboards, it’s about real-world influence. By reframing the experience around speed, persuasion, and profitability, we turned a low-value tool into a high-leverage platform that drove measurable business outcomes.
Tools Used
Figma, Power BI